Reports
DiKAS offers analytics in two places:
- Admin → Reports — tabular reports: Best & Worst Sellers (article statistics), Article Group Analysis (revenue by article group), Weekly Analysis (revenue by hour/weekday), Discounts (by employee), and Points (only if loyalty points are active).
- Admin → Analytics — graphical reports with charts: Revenue (trend, article groups, weekdays, VAT), Staff, Customers, Finance (annual overview with year-over-year comparison), plus module-dependent Disco/Online/Workshop reports.
Filters are generally a from/to date (Analytics also offers a quick selection for 7/30/90/365 days). In addition, the Discounts report has an employee filter, and the hourly/weekly analysis has a weekday filter. There is no general payment method filter in the reports.
ℹ️ The "Revenue Report" description below corresponds in content to the article group/finance area. You'll find the tax-rate breakdown (19/7/0%) in the Financial Overview under Analytics.
Admin → Reports
1. 📊 Revenue Report
Detailed revenue analysis by time period, broken down by tax rates and payment methods.
Filters
| Filter | Description |
|---|---|
| Time period | From-to date |
| Article group | Optional: only specific article groups |
Display
Revenue Report: 03/01 – 03/31/2026

              Gross          VAT          Net
19%:      8,345.20 EUR  1,332.64 EUR  7,012.56 EUR
 7%:      3,217.50 EUR    210.51 EUR  3,006.99 EUR
 0%:        450.00 EUR      0.00 EUR    450.00 EUR
────────────────────────────────────────────────
Total:   12,012.70 EUR  1,543.15 EUR 10,469.55 EUR

Payment methods:
  Cash:                6,789.30 EUR  (56.5%)
  Debit card:          4,123.40 EUR  (34.3%)
  Credit card:           650.00 EUR  (5.4%)
  Customer credit:       250.00 EUR  (2.1%)
  Voucher:                200.00 EUR  (1.7%)

Other:
  Discounts:              345.00 EUR
  Tips:                   189.50 EUR
  Voids:          4        42.30 EUR
  Receipts:     312
Included Key Figures
| Key Figure | Description |
|---|---|
| Gross / Net / VAT | Separated by tax rate (19%, 7%, 0%) |
| Payment methods | Breakdown by method with percentage share |
| Discounts | Total amount of discounts granted |
| Tips | Sum of all tips |
| Voids | Count and amount |
| Receipt count | Total number of receipts in the period |
2. Best & Worst Sellers (Article Statistics)
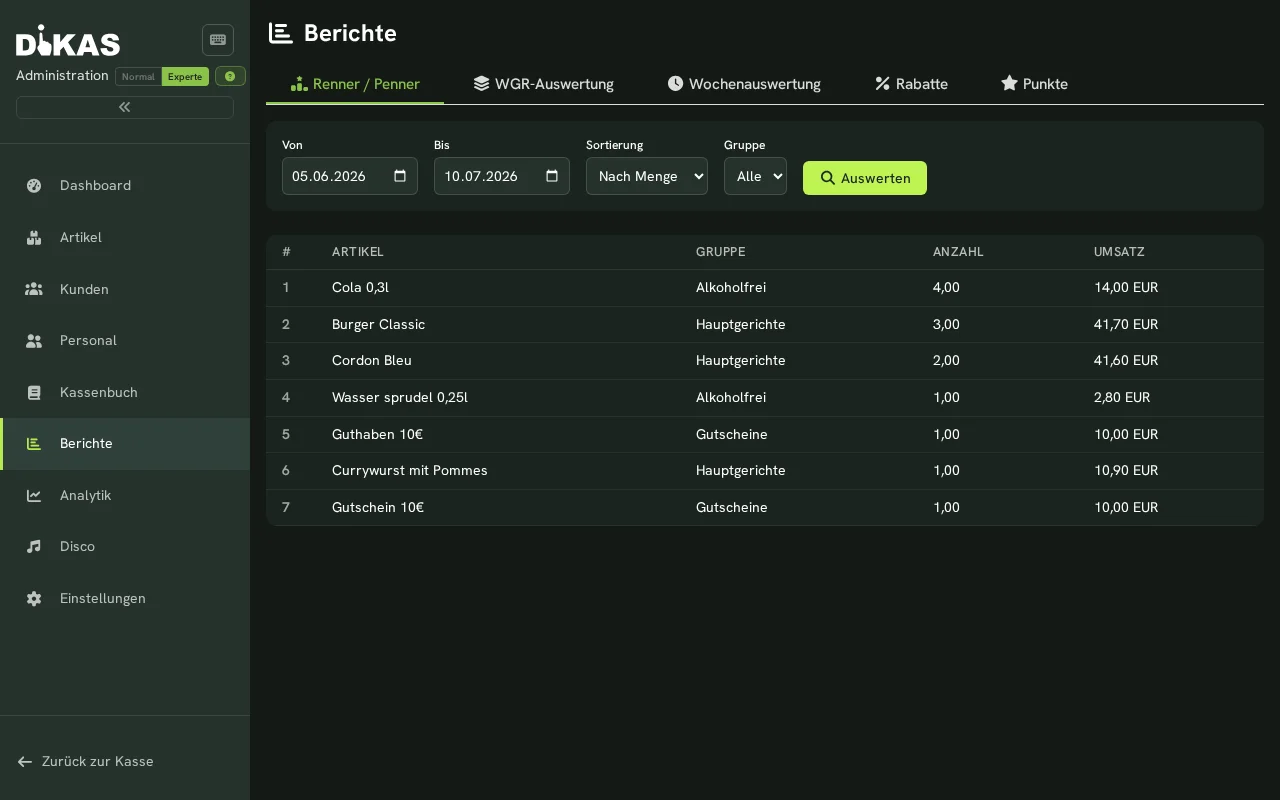
Shows the best-selling and least-selling articles — ideal for menu optimization.
Filters
| Filter | Description |
|---|---|
| Time period | From-to date |
| Sort by | By quantity (bestseller) or by revenue |
| Limit | Top N articles (default: 50) |
| Article group | Optional: only specific groups |
Display
Best Sellers (Top 10):
| Rank | Article | Group | Quantity | Revenue |
|---|---|---|---|---|
| 1 | Weizen 0,5l | Beer | 234 | 982.80 EUR |
| 2 | Cola 0,3l | Soft drinks | 198 | 693.00 EUR |
| 3 | Pizza Margherita | Food | 156 | 1,482.00 EUR |
| 4 | Cappuccino | Coffee | 134 | 469.00 EUR |
| 5 | Schnitzel | Food | 98 | 1,470.00 EUR |
Worst Sellers (Bottom 10):
| Rank | Article | Group | Quantity | Revenue |
|---|---|---|---|---|
| 1 | Grüner Tee | Tea | 2 | 5.60 EUR |
| 2 | Milchshake Vanille | Desserts | 3 | 13.50 EUR |
| 3 | Tonic Water | Soft drinks | 4 | 14.00 EUR |
Purpose: Remove worst sellers from the menu or reposition them. Place best sellers more prominently or review their margins.
3. Article Group Analysis (WGR)
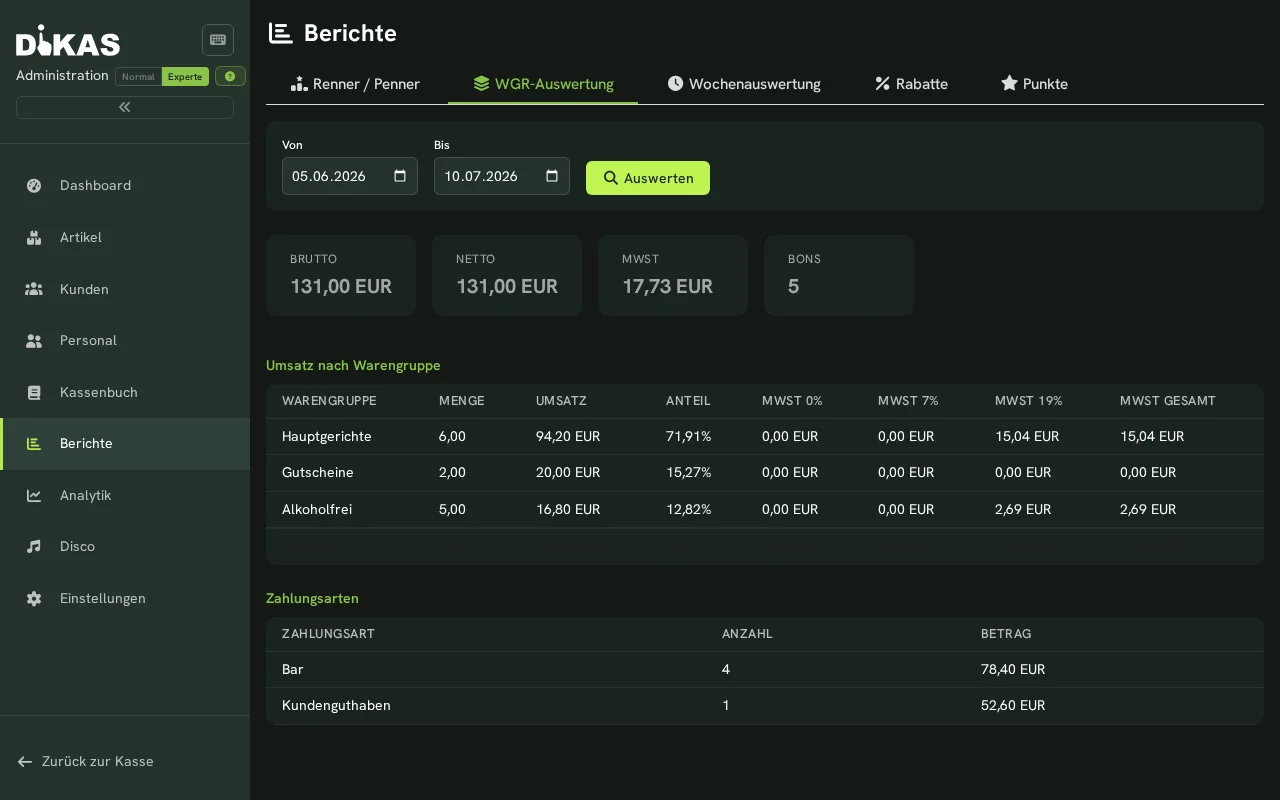
Revenue per article group with percentage share — shows which areas drive your revenue. The table also breaks down VAT for each article group: separated by 0%, the reduced rate, and the standard rate, plus a total. The footer row sums all columns — handy for a quick check against your tax advisor's figures.
Display
Article Groups: March 2026

Group                     Quantity   Revenue       Share   VAT 0%    VAT 7%     VAT 19%    VAT total
Non-alcoholic beverages:       812   3,450.00 EUR  28.7%   0.00 EUR    0.00 EUR   550.76 EUR   550.76 EUR
Beer:                          604   2,890.00 EUR  24.1%   0.00 EUR    0.00 EUR   461.43 EUR   461.43 EUR
Main courses:                  391   3,120.00 EUR  26.0%   0.00 EUR  204.11 EUR     0.00 EUR   204.11 EUR
Starters:                      178     980.00 EUR   8.2%   0.00 EUR   64.11 EUR     0.00 EUR    64.11 EUR
Wine:                           89     890.00 EUR   7.4%   0.00 EUR    0.00 EUR   142.10 EUR   142.10 EUR
Desserts:                      137     682.70 EUR   5.7%   0.00 EUR   44.66 EUR     0.00 EUR    44.66 EUR
──────────────────────────────────────────────────────────────────────────────────────────
Total:                       2,211  12,012.70 EUR    100%   0.00 EUR  312.88 EUR  1,154.29 EUR 1,467.17 EUR
What are the VAT columns for?
This lets you see at a glance how your tax splits between food (reduced rate) and beverages (standard rate) — without having to check the DATEV export. Example: Pizzeria Da Mario's March figures show 312.88 EUR in reduced-rate VAT and 1,154.29 EUR in standard-rate VAT — matching the rule of thumb of roughly a 40/60 split between food and beverages.
4. Hourly Revenue Analysis
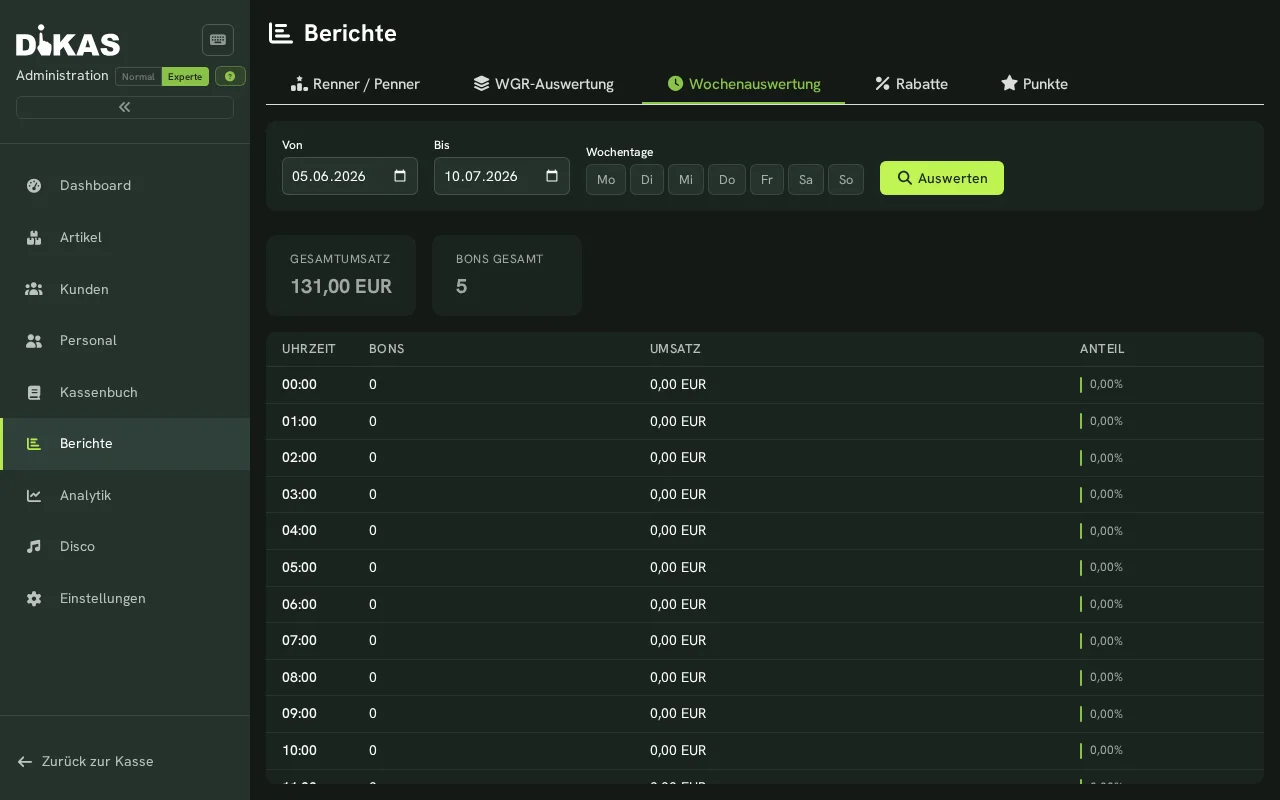
Revenue by hour of day — shows when your business generates the most revenue.
Filters
| Filter | Description |
|---|---|
| Time period | From-to date |
| Weekdays | Optional: only specific weekdays (e.g. Friday + Saturday only) |
Display
Hourly Analysis: March 2026

Hour    Receipts  Revenue        Share
 8:00      5      42.50 EUR      ░░  (0.4%)
 9:00     12     134.80 EUR      █░  (1.1%)
10:00     18     215.40 EUR      ██  (1.8%)
11:00     34     478.90 EUR      ████  (4.0%)
12:00     67   1,245.00 EUR      ██████████  (10.4%)
13:00     58   1,034.20 EUR      █████████  (8.6%)
14:00     23     312.00 EUR      ███  (2.6%)
...
18:00     45     890.00 EUR      ████████  (7.4%)
19:00     72   1,567.00 EUR      ████████████  (13.0%)
20:00     68   1,423.50 EUR      ████████████  (11.9%)
21:00     42     987.00 EUR      ████████  (8.2%)
22:00     18     345.00 EUR      ███  (2.9%)
Purpose: Optimize staff scheduling — more employees during peak hours, fewer during off-peak hours.
Weekday filter: Filter e.g. only Friday and Saturday to see whether extended weekend opening hours are worthwhile.
5. Discounts Report
Under Admin → Reports → Discounts you see all discounts granted in the period — broken down by employee.
Filters
| Filter | Description |
|---|---|
| Time period | From-to date |
| Employee | Optional: only discounts from a specific employee |
Purpose: Check who grants how many discounts and how large they are. The employee filter lets you analyze a single waiter specifically.
6. Revenue per Workstation
A revenue breakdown per workstation is included in the Z-report (end-of-day report) (section "Revenue per Workstation"). There is currently no dedicated "Workstation Report" under Admin → Reports.
7. 📈 Financial Overview (Annual Report)
Comprehensive annual report with optional year-over-year comparison.
Filters
| Filter | Description |
|---|---|
| Year | Reporting year |
| Comparison year | Optional: year-over-year comparison (e.g. 2025 vs. 2024) |
Annual Key Figures
| Key Figure | Description |
|---|---|
| Total revenue | Annual revenue (gross) |
| Total costs | Sum of all expenses |
| Profit | Revenue − costs |
| Profit margin | Profit / revenue × 100 |
| Receipt count | Total number of receipts in the year |
| Business days | Number of days with revenue |
| Average/day | Revenue / business days |
| Average/receipt | Revenue / receipt count |
Monthly Overview
| Month | Revenue | Costs | Profit | Change |
|---|---|---|---|---|
| Jan | 11,234 EUR | 3,456 EUR | 7,778 EUR | +5.2% |
| Feb | 10,890 EUR | 3,210 EUR | 7,680 EUR | −1.3% |
| Mar | 12,012 EUR | 3,890 EUR | 8,122 EUR | +12.4% |
| ... |
The "Change" column shows the percentage difference from the comparison year (if specified).
Additional Analyses
| Section | Content |
|---|---|
| Revenue by article group | Group revenue with percentage share |
| Costs by category | Expense categories with percentage share |
| Payment methods overview | Method, amount, count, percentage |
| Tax summary | Net, tax, gross per tax rate |
| Open items | Open invoices by dunning level and due-date buckets |
Open Items (Due-Date Buckets)
| Bucket | Description |
|---|---|
| Overdue | Already past due |
| 7 days | Due within 7 days |
| 14 days | Due within 14 days |
| 30 days | Due within 30 days |
| 60 days | Due within 60 days |
| 60+ days | Due after more than 60 days |
Deposit & Empties (Circulation)
Under Admin → Reports → Deposit & Empties you can see how many cups, plates or cutlery items have been issued, taken back and are still in circulation – across all tills combined. This suits markets and events with several tills: a return at a different till than the one that issued the item is counted automatically. Like the other POS reports, it is available as long as the POS permission "Hide revenue" is not set.
| Field | Meaning |
|---|---|
| From / To | The period for Issued and Taken back |
| Circulation since | Start of the circulation calculation, e.g. the first market day. Deposits issued before that date are not counted |
| In circulation | Issued minus taken back since the cut-off date |
| Outstanding deposit amount | The deposit amount in euros that is still with guests since the cut-off date |
The evaluation is calculated from the receipts; voided receipts are not counted. A card deposit refund counts as a return. A negative circulation (red) means more deposit came back than was issued since the cut-off date – usually the cut-off date was chosen too late. Use Export CSV to save the table for Excel.
Counting cups, plates and cutlery separately
Only items that have their own deposit article are shown separately. Create one deposit article per kind (type Deposit) and assign it to the articles – see Deposit Articles. Otherwise the general deposit appears as one combined line.
Loyalty Points Report
Under Admin → Reports → Points you'll find the analysis of the loyalty points program:
| Key Figure | Description |
|---|---|
| Points in circulation | Total of all unredeemed points |
| Points earned | Points earned in the period |
| Points redeemed | Points redeemed in the period |
| Discount value | Monetary value of the redeemed points |
Top Customers (Points)
| Customer | Total Points | Earned | Redeemed |
|---|---|---|---|
| Frau Weber | 342 | 187 | 45 |
| Herr Schmidt | 256 | 134 | 22 |
| Familie Müller | 198 | 98 | 50 |
Report Filters
All reports support these common filters:
| Filter | Description |
|---|---|
| Time period | From-to date |
| Article group | Only for Best/Worst Sellers: specific article group |
ℹ️ The Discounts report additionally has an employee filter (only discounts from a specific employee), and the hourly/weekly analysis has a weekday filter (Mon–Sun, multi-select). A general payment method filter is not currently available in the reports.
📥 Export
The reports under Admin → Reports/Analytics do not offer a direct PDF/Excel export.
- For tax-relevant exports, use the DATEV export (Admin → Accounting) → DATEV Export as well as the TSE/DSFinV-K exports (Admin → Settings → TSE).
- Individual receipts can be opened as a PDF in the Cash Book.
Practical Example: Monthly Report
Situation: A restaurant manager wants to analyze March 2026.
- Revenue report (03/01–03/31): total revenue 12,012.70 EUR, 312 receipts
- Best & worst sellers: Weizen is the bestseller (234×), Grüner Tee is removed from the menu (2×)
- Hourly analysis: peak hours 12:00–13:00 and 19:00–21:00 → schedule one more part-time helper on weekends
- Article groups: beverages make up 60% of revenue, food 40% → review beverage margins
- Financial overview: March +12.4% vs. the previous year → opening the terrace paid off
Frequently Asked Questions
Can I send reports automatically by email? The DATEV export can be handed off to your tax advisor. For ongoing analysis, use the "Reports" and "Analytics" pages directly in the admin area.
How far back do the reports go? Reports access all stored POS data — there is no time limit.
Are voided receipts included in the reports? Voids are shown separately. Net revenue already accounts for voids (they are subtracted).
Next Step
→ Settings — System configuration